Main
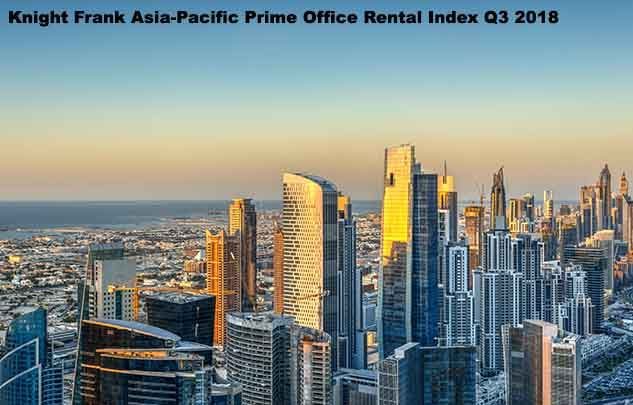
Knight Frank Asia-Pacific Prime Office Rental Index Q3 2018


Knight Frank Asia-Pacific Prime Office Rental Index Q3 2018
Rental growth slows amidst rising trade tensions
22 November 2018, – Knight Frank, the independent global property consultancy, today launched its Asia-Pacific Prime Office Rental Index for Q3 2018. The index increased by 2.3% quarter-on-quarter and 6.4% year-on-year in the third quarter of 2018.
Results for Q3 2018
- The index showed slower growth, as office occupiers delayed significant real estate decisions amidst rising US-China trade tensions
- 18 out of the 20 cities tracked report stable or increased rental growth
- After a strong showing in Q2 2018, Bengaluru’s office market normalised, recording a 0.4% quarter-on-quarter growth
- Tokyo recorded the highest increase this quarter at 5.6% on the back of strong occupier demand and limited supply


Shishir Baijal, Chairman and Managing Director, Knight Frank India, says, “Rentals across major markets have shown a positive trend due to factors such as a growing demand and somewhat restricted supply scenario. The office market space in both Bengaluru and Mumbai has not only revealed optimistic growth in the recent times but is also slated to strengthen further. Going forward, we expect that these factors will help major commercial markets to remain on a sound footing and boost the rental segment in the region.”
Asia-Pacific Prime Office Rents
| City | Submarket(s) | 3-month % change (Q2 2018 – Q3 2018) | Forecast next 12 months |
| Brisbane | CBD | 0.7% | Increase |
| Melbourne | CBD | 2.6% | Increase |
| Perth | CBD | 0.2% | Same |
| Sydney | CBD | 2.5% | Increase |
| Tokyo* | Central 5 Wards | 5.6% | Same |
| Beijing | Various | 0.7% | Increase |
| Guangzhou | CBD | 0.3% | Increase |
| Shanghai | Puxi, Pudong | 0.0% | Decrease |
| Hong Kong | Central | 2.7% | Increase |
| Taipei | Downtown | 0.0% | Increase |
| Seoul | CBD, GBD, YBD | -0.7% | Same |
| Bengaluru | CBD | 0.4% | Increase |
| Mumbai | BKC | 3.9% | Increase |
| NCR | Connaught Place | 0.0% | Same |
| Phnom Penh | City Centre | 0.1% | Same |
| Jakarta | CBD | 0.0% | Same |
| Kuala Lumpur | City Centre | -0.2% | Decrease |
| Singapore | Raffles Place, Marina Bay | 1.1% | Increase |
| Bangkok | CBD | 0.0% | Increase |
| Manila | Various | 0.8% | Decrease |
Source: Knight Frank Research / *Sanko Estate
-


 News3 weeks ago
KW Delhi 6 Mall Onboards New Brands
-


 News4 weeks ago
Manasum Senior Living Launches IKIGAI GOA, A Senior Living Community in North Goa, in collaboration with Prescon Homes
-


 News2 weeks ago
Godrej Properties Sells Rs 3k cr+ Homes of Godrej Zenith, Gurugram, within 3 days
-


 News4 weeks ago
Bridging India Divide: Top 5 Tier- 2 Cities to Focus On
-


 News3 weeks ago
Commercial Realty Gets Tech Savvy: Fast Construction, Enhanced Convenience
-


 News4 weeks ago
Multipoint Connection – A Definite Boon
-


 News3 weeks ago
RBI’s Status Quo on Key Policy Rates to Help Maintain the Real Estate Growth Momentum, Say Industry Stalwarts
-


 News1 week ago
Olive Announces Dhruv Kalro as Co-Founder


