Report
Rental appreciation trumps capital price growth in top luxury markets since 2014

Amidst various industry reforms in the last seven years, multiple new trends emerged in the Indian residential real estate market. Strikingly, housing rentals in key luxury markets saw better y-o-y growth between 2014 and 2020 than average capital prices in the same localities.
 Anuj Puri, Chairman – ANAROCK Property Consultants says, “The average rentals for a house of minimum 2,000 sq. ft. size in the top 7 cities’ key luxury hotspots rose anywhere between 17% and 26% in 2020, as compared to 2014. In the same period, average capital prices in these micro-markets saw a maximum rise of 15% – and some even saw a marginal dip.”
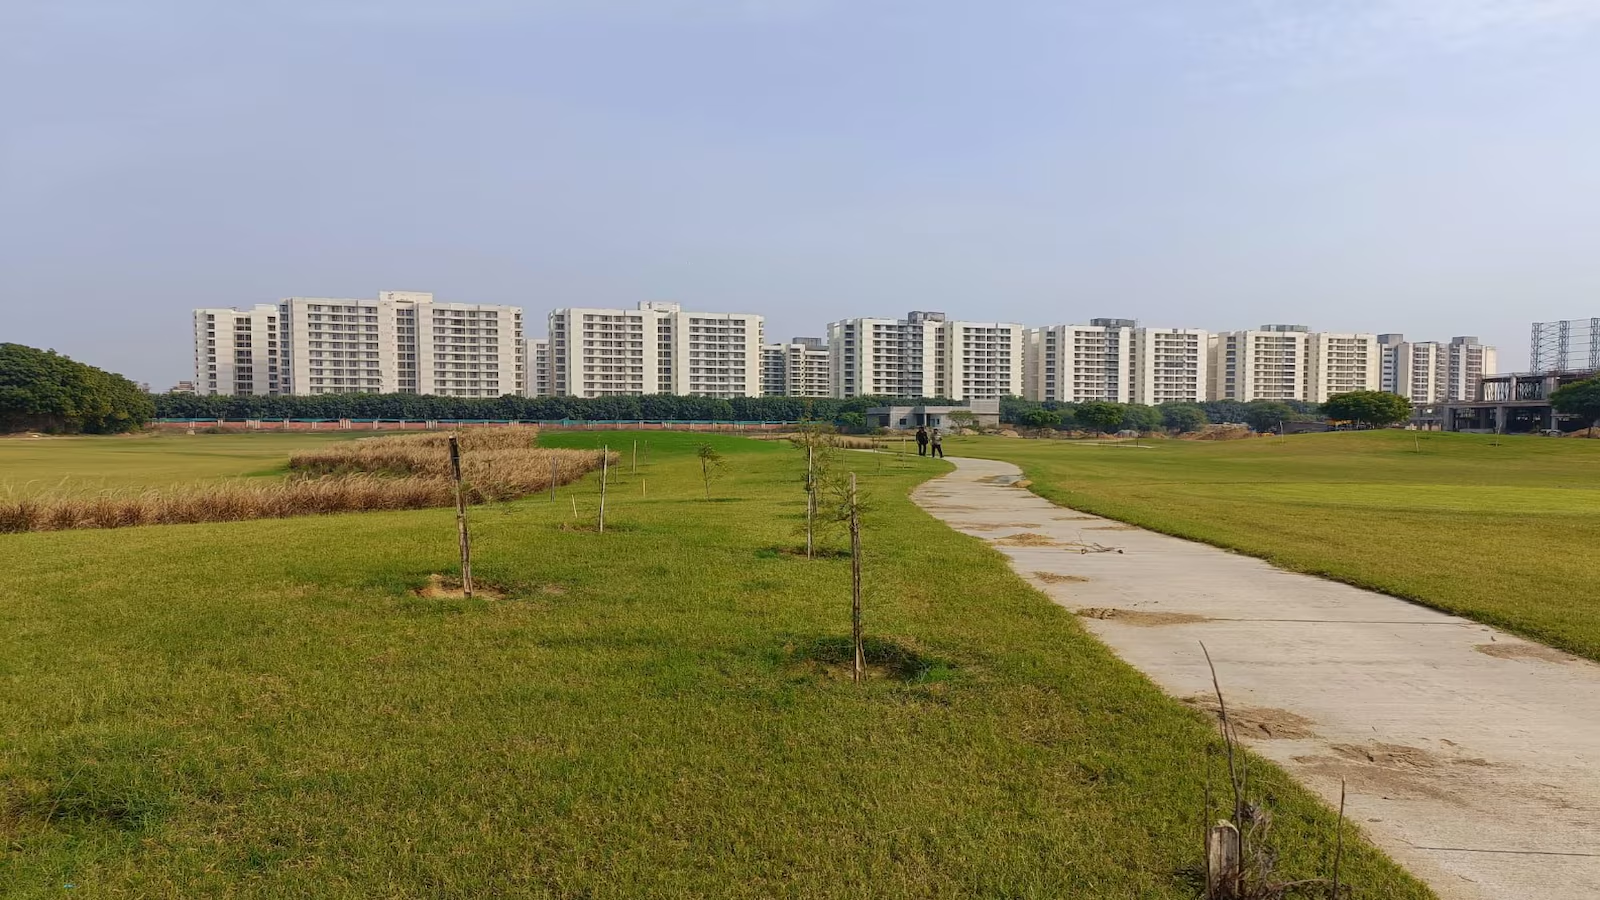
To illustrate – ANAROCK data indicates that the average monthly rentals in Gurugram’s Golf Course Road increased by 17% in 2020 over 2014, while average property prices in the same period declined marginally – from INR 13,167 per sq. ft. in 2014 to INR 13,150 per sq. ft. in 2020.
Among the top 7 cities, Hyderabad’s HITECH City saw the highest rental appreciation of 26% between 2014 and 2020; in the same period, average property prices saw a 12% jump.
“ANAROCK data also reveals that from 2014 to 2020, rental prices in the top luxury markets saw consistent y-o-y growth – averaging between 3-6% annually,” says Mr Puri. “In contrast, capital appreciation in this period either remained range-bound or varied each year. Some years saw a decent yearly rise, even as high as 7%, while prices dropped by approx. -5% in other years – particularly in 2017, when many micro-markets saw capital prices plunge against the preceding year.”
In 2017, various structural reforms like RERA and GST were implemented. After this period, most localities only saw a marginal capital price rise averaging between 1-3% – while rental markets continued their growth run.


Due to the pandemic, 2020 was an outlier year for Indian rental markets, with most luxury localities recording either no change in average monthly rentals (compared to the preceding year) or seeing some decline. Without a doubt, COVID-19 impacted luxury rental markets amidst the growing WFH culture. Average property prices showed little or no change in 2020 over 2019.
Top Luxury Hotspots – Rental vs Capital Price Changes
The luxury residential rental market saw a setback due to COVID-19, but now appears to have recovered with demand for rental luxury properties back almost to pre-COVID levels. Monthly rentals in some of the localities have begun heading north. With vaccinations now rolling out and positivity returning, these rental market will pick up new momentum.
Some of the prominent luxury markets in the top 7 cities that performed well between 2014 and 2020 may see further short to mid-term boosts:
- In Bengaluru, the luxury residential hotspot JP Nagar saw avg. monthly rentals appreciate by 24% in 2020 over 2014, while capital prices in the period rose by 8%. Likewise, Rajajinagar saw rental prices rise by 22%, and capital prices by 15%.
- In MMR, luxury rentals in Tardeo rose 23% in this period, while capital prices increased by 8%. Similarly, in Worli, the average monthly rentals for a minimum 2,000 sq. ft. area home rose by 21%, while capital prices rose by 6%.
- In NCR, rentals in luxury hotspot Golf Course Road increased by 17% while capital prices saw a meagre decline. In contrast, Golf Course Extension Road saw rentals increase by 18% and capital prices by 7% in this period.
- In Chennai, luxury rentals in Anna Nagar rose 17% in this period, while capital prices increased by 10%. Similarly, in Kotturpuram, the average monthly rentals rose by 19% while capital prices rose by 7%.
- In Hyderabad, the luxury residential hotspot Jubilee Hills saw avg. monthly rentals appreciate by 15% in 2020 over 2014, while capital prices in this period rose 10%. HITECH City saw the maximum rental price rise of 26%, while capital prices increased by 12%.
- In Pune, the rentals in Koregaon Park rose 19% in this period, while capital prices increased by 14%. Similarly, in Prabhat Road, the average monthly rentals rose by 23% while capital prices rose by just 5%.
- In Kolkata, luxury home rentals in Alipore rose 20% in 2020 against 2014, while capital prices increased by 13%. Similarly, in Ballygunge, the average monthly rentals rose 19% while capital prices rose by 13%.
| Avg. Monthly Rentals: Top Luxury Markets (For 2,000 sq. ft. area) | ||||
| City | Micro Market | 2014 (INR) | 2020 (INR) | % Appreciation (2020 vs 2014) |
| Bengaluru | JP Nagar | 37,000 | 46,000 | 24% |
| Bengaluru | Rajaji Nagar | 46,000 | 56,000 | 22% |
| Chennai | Anna Nagar | 48,000 | 56,000 | 17% |
| Chennai | Kotturpuram | 62,000 | 74,000 | 19% |
| Hyderabad | Jubilee Hills | 47,000 | 54,000 | 15% |
| Hyderabad | HiTech City | 42,000 | 53,000 | 26% |
| Kolkata | Alipore | 50,000 | 60,000 | 20% |
| Kolkata | Ballygunge | 74,000 | 88,000 | 19% |
| MMR | Tardeo | 2,20,000 | 2,70,000 | 23% |
| MMR | Worli | 1,65,000 | 2,00,000 | 21% |
| NCR | Golf Course Ext. Rd | 42,500 | 50,000 | 18% |
| NCR | Golf Course Rd | 60,000 | 70,000 | 17% |
| Pune | Koregaon Park | 50,000 | 59,500 | 19% |
| Pune | Prabhat Road | 52,000 | 64,000 | 23% |
Source: ANAROCK Research
| Avg. Capital Prices: Top Luxury Micro Markets | ||||
| City | Micro Markets | 2014 (INR/sft.) | 2020 (INR/sft.) | % Appreciation (2020 vs 2014) |
| Bengaluru | JP Nagar | 5,259 | 5,698 | 8% |
| Bengaluru | RajajiNagar | 11,534 | 13,300 | 15% |
| Chennai | Anna Nagar | 10,288 | 11,300 | 10% |
| Chennai | Kotturpuram | 12,650 | 13,500 | 7% |
| Hyderabad | Jubilee Hills | 6,300 | 6,950 | 10% |
| Hyderabad | HiTech City | 5,088 | 5,675 | 12% |
| Kolkata | Alipore | 11,500 | 13,000 | 13% |
| Kolkata | Ballygunge | 10,005 | 11,350 | 13% |
| MMR | Tardeo | 38,717 | 41,862 | 8% |
| MMR | Worli | 36,388 | 38,560 | 6% |
| NCR | Golf Course Ext. Rd | 7,778 | 8,300 | 7% |
| NCR | Golf Course Rd | 13,167 | 13,150 | 0% |
| Pune | Koregaon Park | 9,794 | 11,128 | 14% |
| Pune | Prabhat Road | 11,850 | 12,500 | 5% |
Source: ANAROCK Research


NCR Saw 29 Land Deals for Nearly 314 Acres Closed in FY-24: ANAROCK Report
New Delhi, April 24, 2024: Delhi-NCR continues to be a hotspot for real estate transactions across various sectors and as in the...


hBits Forays in Pune, Acquires Grade A Commercial Property in Magarpatta
Pune, April 24, 2024: hBits, a leading fractional ownership platform, has marked its entry in Pune with the acquisition of...


RERA Gurugram Slaps Rs 50 Lakh Penalty on Countrywide Promoters for Publishing of Misleading Advertisement
Gurugram, April 23, 2024: The real estate regulatory authority (RERA), Gurugram, has imposed a penalty of Rs 50 Lakh on...


Everest Composites Launches FIBEROD FRP Rebars
Vadodara, April 24, 2024: Everest Composites Pvt. Ltd. (ECPL), manufacturers of composites products since 1991, announced the launch of its...

UP RERA Imposes Penalty on the Allottee For Misuse of the Process of Law
Lucknow/ Gautambudh Nagar: UP RERA Chairman has imposed heavy penalty upon the allottee who was found continuously misusing the process...


NBCC Secures Rs 23.5k cr New Works in FY24
New Delhi, April 23, 2024: NBCC secured significant business during FY’23-24 and it has secured record new works of Rs....
-
 News3 weeks ago
KW Delhi 6 Mall Onboards New Brands
-
News4 weeks ago
Manasum Senior Living Launches IKIGAI GOA, A Senior Living Community in North Goa, in collaboration with Prescon Homes
-
News2 weeks ago
Godrej Properties Sells Rs 3k cr+ Homes of Godrej Zenith, Gurugram, within 3 days
-
News4 weeks ago
Bridging India Divide: Top 5 Tier- 2 Cities to Focus On
-
News3 weeks ago
Commercial Realty Gets Tech Savvy: Fast Construction, Enhanced Convenience
-
News4 weeks ago
Multipoint Connection – A Definite Boon
-
News3 weeks ago
RBI’s Status Quo on Key Policy Rates to Help Maintain the Real Estate Growth Momentum, Say Industry Stalwarts
-
News1 week ago
Olive Announces Dhruv Kalro as Co-Founder