News
August Property Registrations in Mumbai at 10,550, Rs 790 cr Stamp Duty Collected
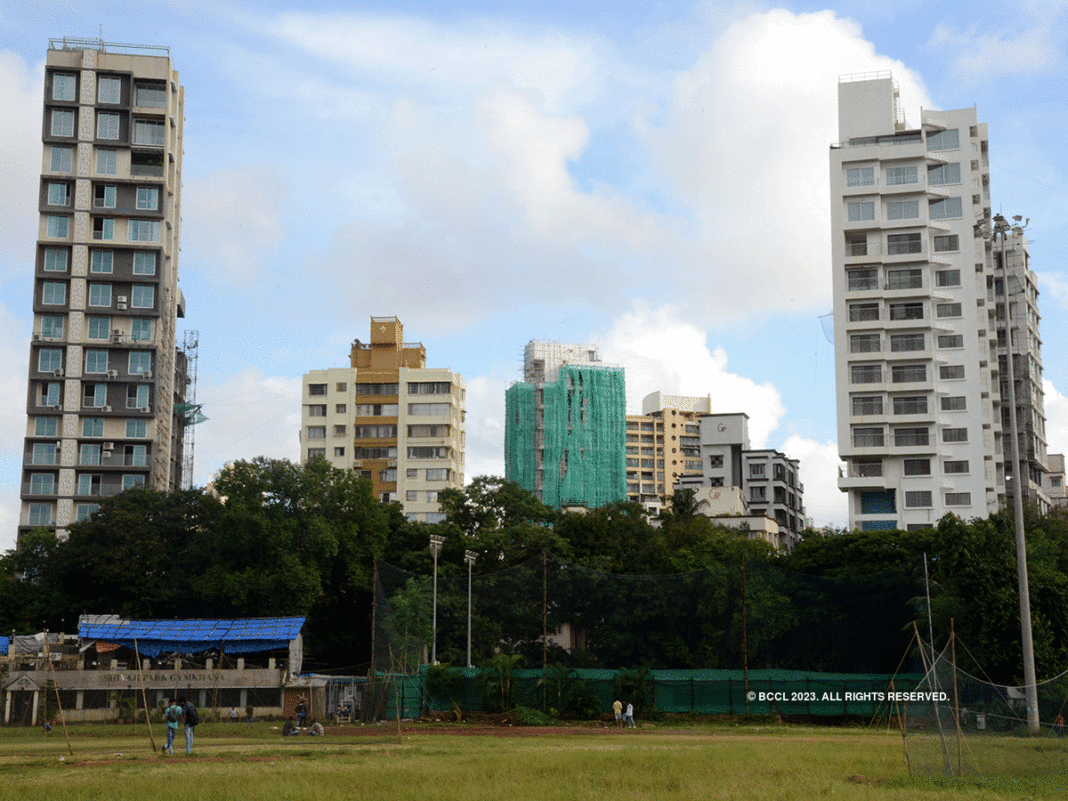

Mumbai, August 31, 2023: Mumbai city (area under BMC jurisdiction) in August 2023 is estimated to witness registration of 10,550 properties, contributing to a revenue influx of INR 790 Crores (Cr) for the state government. This showcases a 23% surge in registrations and revenue compared to the preceding year. Of the overall registered properties, residential units constitute 80%, the remaining 20% constitute non-residential assets.
Table: Mumbai property sale registrations and government revenue collection
Period Registration
(Units)YoY MoM Revenue
(INR cr)YoY MoM Aug-22 8,552 26% -25% 644 53% -22% Sep-22 8,628 11% 1% 734 39% 14% Oct-22 8,422 -2% -2% 724 32% -1% Nov-22 8,965 18% 6% 684 24% -6% Dec-22 9,367 -3% 4% 835 10% 22% Jan-23 9,001 10% -4% 692 45% -17% Feb-23 9,684 -7% 8% 1,112 81% 61% Mar-23 13,151 -21% 36% 1,226 6% 10% Apr-23 10,514 -10% -20% 900 22% -27% May-23 9,823 0% -7% 833 15% -7% Jun-23 10,319 4% 5% 859 17% 3% Jul-23 10,221 -10% -1% 831 0.3% -3% Aug-23* 10,550 23% 3% 790 23% -5%
Source: Maharashtra Govt- Dept. of Registrations and Stamps (IGR); Knight Frank India
*Note: Data for August 2023 is estimated based on per day run rate
Table: Best August in last 10-years (2013-2023)
| Month-wise | Sales Registration | YoY change | MoM change | Revenue (INR Cr) | YoY change | MoM change |
| Aug-13 | 4,779 | NA | -7% | 239 | NA | -17% |
| Aug-14 | 5,031 | 5% | -4% | 297 | 24% | -6% |
| Aug-15 | 5,573 | 11% | -4% | 347 | 17% | -14% |
| Aug-16 | 5,444 | -2% | -5% | 324 | -7% | -5% |
| Aug-17 | 4,886 | -10% | -20% | 348 | 7% | -5% |
| Aug-18 | 6,862 | 40% | 7% | 442 | 27% | 0% |
| Aug-19 | 5,873 | -14% | 2% | 500 | 13% | 11% |
| Aug-20 | 2,642 | -55% | -1% | 176 | -65% | -18% |
| Aug-21 | 6,784 | 157% | -31% | 421 | 139% | -26% |
| Aug-22 | 8,552 | 26% | -25% | 644 | 53% | -22% |
| Aug-23* | 10,550 | 23% | 3% | 790 | 23% | -5% |
Source: Maharashtra Govt- Dept. of Registrations and Stamps (IGR); Knight Frank India Research
*Note: Data for August 2023 is estimated based on per day run rate
August 2023 marked a significant milestone for the city, achieving its most successful August month in the past decade in terms of both registration numbers and revenue generated. This indicates the enduring robustness of Mumbai’s residential real estate sector and the unwavering trust of property purchasers, despite the uptick in interest rates and property prices. Such resilience can be attributed to factors like rising income levels and positive attitudes towards homeownership.
Table: Preferred location of Property purchase – August 2023
Buyers’ location Preferred Micro market Central Mumbai Central Suburbs South Mumbai Western Suburbs Out of city Central Mumbai 40% 0% 0% 5% 0% Central Suburbs 36% 84% 0% 20% 41% South Mumbai 3% 0% 64% 0% 9% Western Suburbs 21% 16% 36% 75% 50% 100% 100% 100% 100% 100%
The Central and Western Suburbs have experienced a surge in launches in response to strong demand. These areas offer excellent value, with modern amenities provided in most new developments. Additionally, these locales are already well-connected or are set to be linked through upcoming metro networks, further enhancing the attractiveness of these properties.
Remarkably, the Central and Western Suburbs have shown a pronounced inclination for buyers to upgrade within their own micro markets. Around 75% of Western suburb buyers and 84% of Central suburb purchasers opt to invest within their familiar micro market. This choice is influenced by the familiarity of the location, along with the availability of products that align with their pricing and feature preferences.
Table: Mumbai property sale registrations and government revenue collection
Jan-Aug2013 – 2023 Registration YoY Revenue YoY Jan-Aug (Units) Jan-Aug (INR cr) 2013 44,583 NA 2,434 NA 2014 41,533 -7% 2,340 -4% 2015 45,609 10% 2,769 18% 2016 44,099 -3% 2,734 -1% 2017 44,090 0% 3,499 28% 2018 54,939 25% 3,809 9% 2019 46,013 -16% 3,685 -3% 2020 23,225 -50% 1,740 -53% 2021 78,270 237% 3,723 114% 2022 86,653 11% 5,924 59% 2023 83,263 -4% 7,242 22%
During the initial eight months of 2023, the city achieved a remarkable registration count of 83,263 units, resulting in a substantial revenue accumulation of INR 7,242 crore for the state treasury. This achievement stands as the highest within the same timeframe since 2013. This surge in property registrations has notably bolstered the Government of Maharashtra’s financial position. The elevated revenue growth can be attributed to various factors, including the registration of higher-value properties and an augmented stamp duty rate.
Shishir Baijal, Chairman & Managing Director, Knight Frank India, “Mumbai’s residential market continues to remain strong as aspiring homebuyers embrace the trend. Remarkably, the share of registration of properties valued at INR 1 crore and above continue to rise, led by surge in property prices and increasing preference among home buyers for more spacious accommodation. Overall, the housing market of the city continues to show a positive outlook, bolstered by ongoing consumer demand”.
Higher value properties have seen a consistent increase in share.
Table: Ticket size wise split of property sale registrations
Registrations INR 1 Cr and below INR 1 Cr and Above Jan-Aug 20 52% 48% Jan-Aug 21 47% 53% Jan-Aug 22 46% 54% Jan-Aug 23 43% 57% Registrations INR 1 Cr and below(Units) INR 1 Cr and Above(Units) Jan-Aug 20 12,012 11,213 Jan-Aug 21 36,710 41,560 Jan-Aug 22 40,108 46,545 Jan-Aug 23 35,803 47,460
Over the recent years, there has been a consistent upward trajectory in the percentage of property registrations for properties valued at INR 1 crore and beyond. This proportion has climbed from 48% in 2020 to around 57% in 2023.
The escalation in property prices, coupled with a significant 250 basis point increase in the interest rate during this timeframe, has influenced property registrations below the INR 1 crore threshold. However, registrations for properties valued at 1 crore and above have demonstrated a relatively minimal response to these changes. Consequently, this has resulted in a noticeable positive impact on the share of property registrations for properties priced above one crore, signifying a sustained demand within this higher price segment of the market.
-


 News4 weeks ago
KW Delhi 6 Mall Onboards New Brands
-



 News4 weeks ago
Manasum Senior Living Launches IKIGAI GOA, A Senior Living Community in North Goa, in collaboration with Prescon Homes
-


 News4 weeks ago
Bridging India Divide: Top 5 Tier- 2 Cities to Focus On
-


 News4 weeks ago
Commercial Realty Gets Tech Savvy: Fast Construction, Enhanced Convenience
-


 News3 weeks ago
Godrej Properties Sells Rs 3k cr+ Homes of Godrej Zenith, Gurugram, within 3 days
-


 News3 weeks ago
RBI’s Status Quo on Key Policy Rates to Help Maintain the Real Estate Growth Momentum, Say Industry Stalwarts
-


 News4 weeks ago
Multipoint Connection – A Definite Boon
-


 News2 weeks ago
Olive Announces Dhruv Kalro as Co-Founder


