Report
Housing sales fell 30%; new launches decline 44% in Q3FY20: PropTiger report
 New Delhi, January 14, 2020: New project launches in India’s nine key residential markets continued to show a decline, falling 44 per cent year-on-year in the period between October and December 2019, primarily on liquidity concerns, shows the report by PropTiger.com, part of Elara Technologies, that also owns Housing.com and Makaan.com.
According to “Real insight Q3FY20”, a quarterly analysis of India’s nine key property markets by PropTiger DataLabs, the ongoing industry concerns related to the NBFC sector, on which real estate developers largely depend on for their financial needs, has made borrowing difficult for builders at a time when a demand slowdown has hit housing sales. This double whammy has resulted in developers continuing to show a cautious stance towards new project launches.
“The various measures launched by the government in the recent past to revive growth in the real estate market seem to have made little impact. Considering real estate is a major contributor to overall GDP, which hit a glacial 4.5 per cent rate of growth in the July-September period, we expect further assistance from the government, which would nudge buyers to invest in real estate. In the Union Budget scheduled to be released on 1st February, we expect the Hon’ble Finance Minister to announce measures that would result in higher savings for individual taxpayers, some of which would hopefully make its way towards property purchases,” said Dhruv Agarwala, Group CEO, Elara Technologies, the country’s only full stack real estate technology platform that owns Housing.com, Makaan.com and Proptiger.com.
Sales fell across cities
Housing sales in India’s nine key property markets fell 30 per cent annually during the October-December quarter despite the government launching several measures in the recent past to revive buyer sentiment. As against 91,464 units sold during the quarter last year, only 64,034 homes were sold across the nine markets in Q3 this year.
Mumbai contributed nearly 40 per cent to overall sales numbers.


What points towards a nation-wide phenomenon, sales declined across all these markets, with Bengaluru, popularly known as India’s Silicon Valley, registering a 50 per cent fall in sales numbers.
When compared to the first nine months of the previous financial year, sales fell by 13 per cent during the same period in the current fiscal. As against 263,294 units last year, only 228,220 housing units were sold this year.
| Units Sold | Growth | ||||||
| City | |||||||
| Q3FY19 | Q4FY19 | Q1FY20 | Q2FY20 | Q3FY20 | YoY (%) Q3vsQ3 | QoQ (%) Q2vsQ3 | |
| Ahmedabad | 5,960 | 6,414 | 6,479 | 5,578 | 5,118 | -14% | -8% |
| Bangalore | 10,299 | 10,092 | 9,600 | 8,425 | 5,155 | -50% | -39% |
| Chennai | 4,467 | 4,605 | 4,571 | 3,772 | 3,015 | -33% | -20% |
| Gurgaon | 4,069 | 6,970 | 5,880 | 3,581 | 3,834 | -6% | 7% |
| Hyderabad | 7,869 | 8,857 | 7,723 | 7,002 | 4,372 | -44% | -38% |
| Kolkata | 3,810 | 4,341 | 4,333 | 3,052 | 2,566 | -33% | -16% |
| Mumbai | 30,850 | 27,527 | 28,726 | 24,882 | 25,198 | -18% | 1% |
| Noida | 4,556 | 4,148 | 3,627 | 3,038 | 2,830 | -38% | -7% |
| Pune | 19,584 | 17,911 | 18,034 | 15,883 | 11,946 | -39% | -25% |
| Grand Total | 91,464 | 90,865 | 88,973 | 75,213 | 64,034 | -30% | -15% |
| Sold Units | |||
| City | |||
| Apr-Dec 18 | Apr-Dec 19 | YoY (%) | |
| Ahmedabad | 17,436 | 17,175 | -1% |
| Bangalore | 31,932 | 23,180 | -27% |
| Chennai | 14,011 | 11,358 | -19% |
| Gurgaon | 11,794 | 13,295 | 13% |
| Hyderabad | 21,505 | 19,097 | -11% |
| Kolkata | 10,754 | 9,951 | -7% |
| Mumbai | 85,811 | 78,806 | -8% |
| Noida | 19,141 | 9,495 | -50% |
| Pune | 50,910 | 45,863 | -10% |
| Grand Total | 263,294 | 228,220 | -13% |
Inventory declined 12%
As buyers showed greater faith towards ready homes, inventory levels, declined 12 per cent during the quarter. From 8.83 lakh unsold housing units at the end of the same period last year, unsold stock fell to 7.75 lakh in Q3 FY20. Mumbai and Pune together contribute 57 per cent of this unsold stock. Also, half of the units in this stock are affordable homes (units priced below Rs 45 lakh).
At the current sales velocity, builders would take 29 months to sell off the existing stock.
| Unsold Inventory | YoY (%) – Q3vsQ3 | QoQ (%) Q2vsQ3 | |||||
| City | Dec/2018 | Mar/2019 | Jun/2019 | Sep/2019 | Dec/2019 | Dec 19 Vs Dec 18 | Dec 19 Vs Sep 19 |
| Ahmedabad | 60,015 | 57,220 | 52,294 | 50,690 | 48,367 | -19% | -5% |
| Bangalore | 86,335 | 83,447 | 80,520 | 79,046 | 79,496 | -8% | 1% |
| Chennai | 36,642 | 37,344 | 35,384 | 33,304 | 33,694 | -8% | 1% |
| Gurgaon | 46,364 | 44,469 | 44,522 | 44,199 | 42,071 | -9% | -5% |
| Hyderabad | 42,140 | 41,509 | 38,349 | 35,216 | 33,227 | -21% | -6% |
| Kolkata | 46,364 | 44,861 | 42,040 | 40,029 | 37,979 | -18% | -5% |
| Mumbai | 338,894 | 328,052 | 317,253 | 305,018 | 296,465 | -13% | -3% |


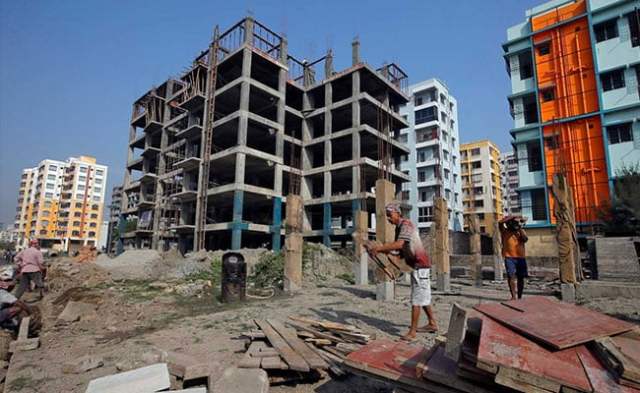
Real Estate, a Huge Employment Generator
The real estate sector in India has been a significant source of employment, with a notable increase observed in recent...

Provident Housing Secures Rs 1,150 Crores Investment from HDFC Capital, with a Potential GDV of Rs 17,100 Crores
Delhi, April 25, 2024: Provident Housing Limited, a wholly owned subsidiary of Puravankara Limited, announced a Rs 1,150 crore investment...

Lohia Global Forays into Real Estate, Earmarks Rs 1000 Crore Investment
New Delhi, April 25, 2024: Lohia Global has announced its venture into the Indian real estate market with Lohia Worldspace. Led by Pyush...


Sumadhura Group Acquires 40 Acres of Residential Land Parcel in Bengaluru
Bengaluru, April 25, 2024: In the midst of a significant upswing in the real estate market in Bengaluru, Sumadhura Group on...


Omaxe Chowk Launches “Filmy” Campaign: Highlights Modern Shopping Experiences in Medieval Chandni Chowk
Delhi, April 24, 2024: Omaxe Chowk, the commercial destination in the heart of Chandni Chowk, Old Delhi, released a ‘film dialogue-based’...


SKA Forays In Luxury Housing: Launches SKA Destiny One in Greater Noida, To Invest Rs 592 Crores
New Delhi, April 24, 2024: NCR based real estate developer, SKA Group announced its foray into the luxury segment and...
-
 News4 weeks ago
KW Delhi 6 Mall Onboards New Brands
-
News4 weeks ago
Manasum Senior Living Launches IKIGAI GOA, A Senior Living Community in North Goa, in collaboration with Prescon Homes
-
News4 weeks ago
Bridging India Divide: Top 5 Tier- 2 Cities to Focus On
-
News4 weeks ago
Commercial Realty Gets Tech Savvy: Fast Construction, Enhanced Convenience
-
News3 weeks ago
Godrej Properties Sells Rs 3k cr+ Homes of Godrej Zenith, Gurugram, within 3 days
-
News4 weeks ago
Multipoint Connection – A Definite Boon
-
News3 weeks ago
RBI’s Status Quo on Key Policy Rates to Help Maintain the Real Estate Growth Momentum, Say Industry Stalwarts
-
News2 weeks ago
Olive Announces Dhruv Kalro as Co-Founder