News
Industrial & Logistics Sector Demand Grows 22.7% YoY in Q1 2024: Savills India Report
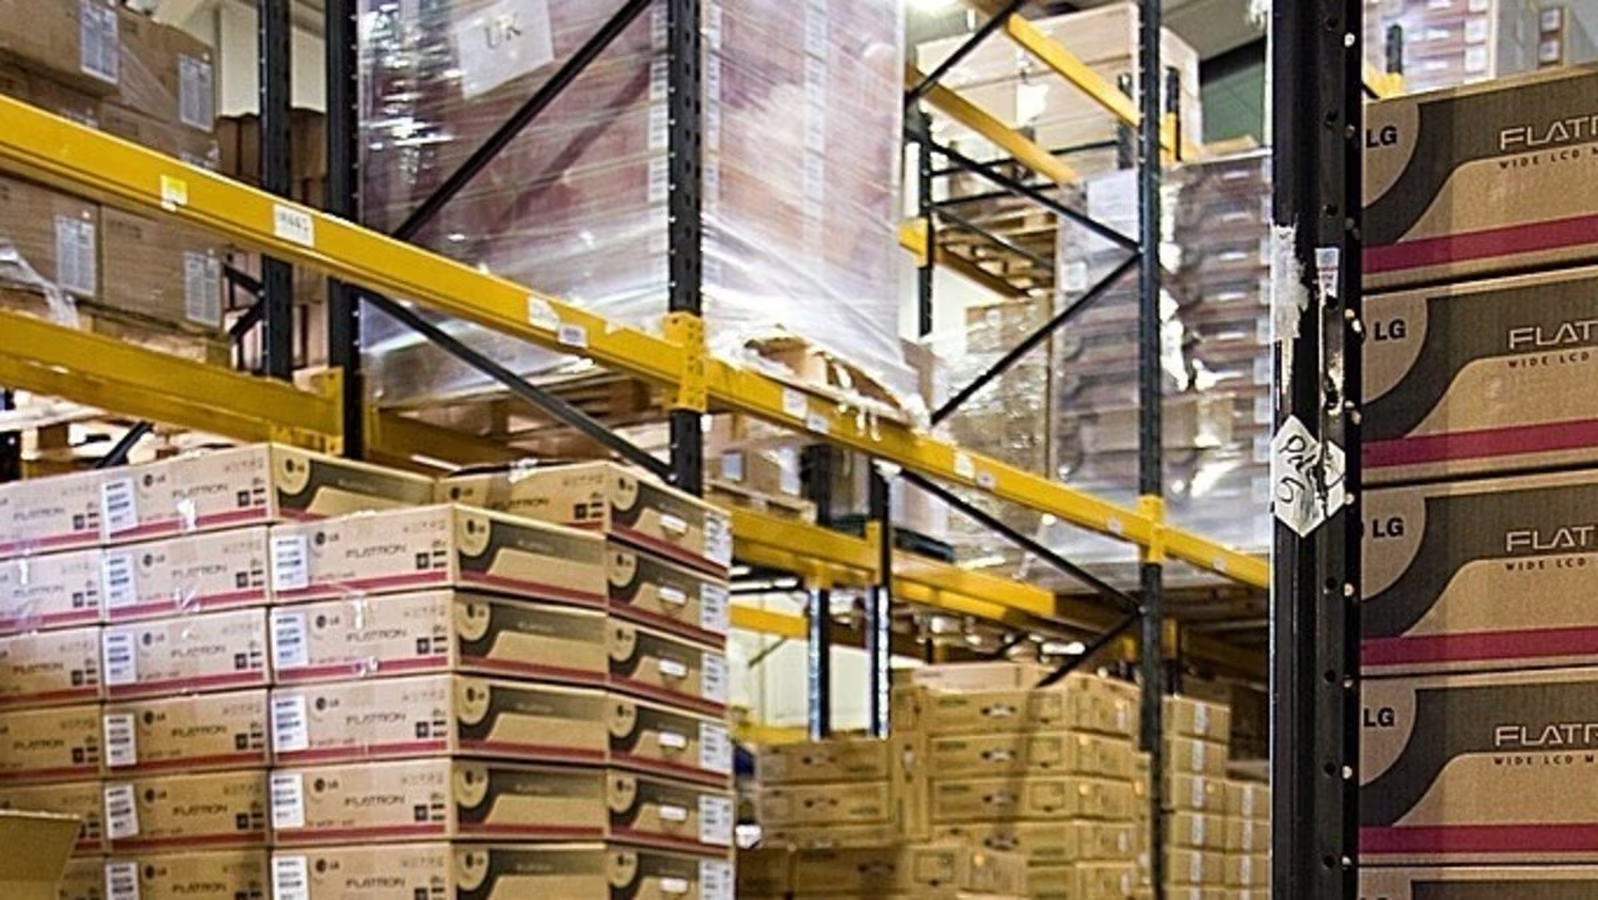
April 11, 2024: The industrial and logistics sector started the year on an impressive note, with a strong absorption of 13.5 mn sq. ft. in Q1 2024 compared to 11.0 million sq. ft. in Q1 2023, representing 22.7% Y-o-Y growth. Tier I cities witnessed 78% of the absorption, while tier II and III cities accounted for the remaining 22%.
The overall absorption during Q1 2024 is led by sustained demand from the 3PL and manufacturing sectors as well as a surge in demand from the FMCG sector. In addition, the uptake of manufacturing warehouses has significantly contributed to the overall absorption, according to the latest report by Savills India, an International real estate advisory firm.
The report suggests that the sector witnessed a fresh supply of 12.9 mn sq. ft. in Q1 2024, indicating a 4% growth rate from Q1 2023 levels, of which 9.8 mn sq. ft. (76%) was from tier I cities and 3.1 mn sq. ft. (24%) from tier II and III cities.
Q1 2024 vs Q1 2023: Absorption across cities
Absorption (Mn sq. ft and %) in Q1 2024 Absorption (Mn sq. ft and %) in Q1 2023 Y-o-Y change (%) Overall 13.5 11.0 22.7% Tier I 10.5 8.4 25% Tier II & III 3.0 2.5 20% Tier I (% of total) 78% 77% Tier II & III (% of total) 22% 23%
Q1 2024 vs Q1 2023: Supply across cities


| Segment | Supply (Mn sq. ft and %) in Q1 2024 | Supply (Mn sq. ft and %) in Q1 2023 | Y-o-Y change (%) |
| Overall | 12.9 | 12.4 | 4.0% |
| Tier I | 9.8 | 9.2 | 6.5% |
| Tier II & III | 3.1 | 3.2 | -3.1% |
| Tier I (% of total) | 76% | 74% | |
| Tier II & III (% of total) | 24% | 26% |
Note: Tier I includes Ahmedabad, Bangalore, Chennai, Hyderabad, Kolkata, Mumbai, Delhi-NCR, and Pune. Tier II and Tier III cities include Guwahati, Bhubaneshwar, Patna, Hosur, Coimbatore, Rajpura, Lucknow, Jaipur, Nagpur, Surat and Indore.
Q1 2024 vs Q1 2023 Grade Wise Supply & Absorption (%)
Q1 2024 Q1 2023 Grade A Grade B Grade A Grade B Supply 45% 55% 52% 48% Absorption 41% 59% 52% 48%
Grade A space accounted for 45% of the supply and 41% of the absorption in Q1 2024. Changing occupier preferences to meet ESG (Environmental, Social, and Governance) standards are likely to drive demand for Grade A warehousing and ready-fitted-out factory space.
Q1 2024 vs Q1 2023: Sector wise Absorption (%)
Sector Q1 2024 Q1 2023 3PL 36% 40% E-Commerce 7% 5% Manufacturing 25% 23% Retail 5% 11% FMCG/FMCD 13% 7% Others 14% 14%
Note: Others including manufacturing warehousing, cold storage, chemical storage, FTWZs, ICDs, and Urban Warehousing
The demand composition has remained nearly unchanged in the recent past with most demand segments growing at comparable rates. 3PL, the largest constituent of demand, accounted for 36% of the overall absorption in Q1 2024. Tier II & III cities witnessed a surge in 3PL absorption, as growing supply chain outsourcing creates avenues for more warehousing spaces.
The manufacturing sector, supported by various government incentive schemes, has played a significant role in driving demand. This is one of the demand-constituents that rose noticeably from 16% in 2022 to 23% in Q1 2023. It holds a stabilized 25% share in Q1 2024. The FMCD sector too has gained momentum and witnessed 13% of total absorption witnessed in Q1 2024 compared with 7% in Q1 2023. Others, including manufacturing warehousing, cold storage, chemical storage, FTWZs, ICDs, and Urban Warehousing, contribute around 14%.
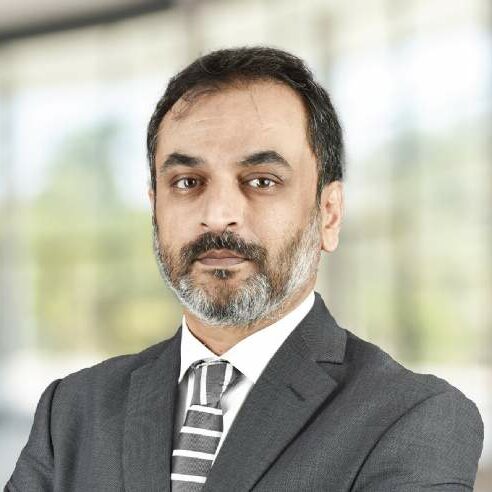
“The growing trend of supply chain outsourcing has resulted in increased expansion of 3PL players in tier II & III cities, leading to higher demand for warehousing space. Manufacturing sector continues to account for over 25% of the total absorption, with improved manufacturing activities likely to drive increased uptake of manufacturing warehouses as well. The e-commerce sector is likely to witness a surge in activity going forward. The sector is amplifying its urban distribution and extending its reach to tier II & III cities. The tier II and III cities are likely to witness significant growth as prominent hubs for sourcing, consumption, and distribution”. Srinivas N, Managing Director, Industrial and Logistics, Savills India.
Q1 2024 Vs Q1 2023: City wise Supply and Absorption (%)
Supply (%) Absorption (%) Q1 2024 Q1 2023 Q1 2024 Q1 2023 Ahmedabad 4% 9% 5% 7% Bangalore 12% 6% 12% 9% Chennai 9% 11% 6% 8% Hyderabad 2% 4% 6% 7% Kolkata 10% 10% 9% 6% Mumbai 8% 7% 7% 14% Delhi-NCR 23% 21% 21% 19% Pune 8% 6% 12% 7% Tier II & III Cities 24% 26% 22% 23%
In Q1 2024, Delhi-NCR remained at the top with the highest contribution of 23% to total supply, closely followed by Bengaluru and Kolkata with 12% and 10% respectively. The tier II and tier III cities together accounted for 24% of the total supply.
In terms of absorption, Delhi-NCR lead the pack with highest contribution of 21% in Q1 2024, followed by Pune and Bengaluru, each at 12%. The contribution of Pune to the overall absorption increased from 7% in Q1 2023 to 12% in Q1 2024, while it decreased for Mumbai from 14% in Q1 2023 to 7% in Q1 2024.

InfraMantra Surpasses Rs 1000 Crore Sales Target; Eyes Ambitious Rs 2000 Cr for FY25
New Delhi, April 29, 2024 – InfraMantra, announced its achievement of exceeding its sales target of Rs 1000 crore for...


NAREDCO Maharashtra Organizes Knowledge Session, ‘All about Policy’ in Mumbai
Mumbai, April 29, 2024: The National Real Estate Development Council (NAREDCO) Maharashtra in association with Practicing Engineers, Architects and Town...


Tulip Infra Launches Tulip Monsella PhaseII Over Rs 300 Cr in Bookings on Day One
New Delhi, April 29, 2024: Luxury real estate in Gurugram experiences a surge as Tulip Infratech launched Phase-II of the...
At 4.45% Bengaluru’s Rental Yield Highest in Q1 2024, Mumbai Next with 4.15%: ANAROCK
Mumbai, April 29, 2024: With a steep rise in rental housing demand in the top cities, average rental values have soared...


DLF Mall Commemorates 8th Anniversary with Thrilling Run, Gul Panag Leads the Charge Under the Active Noida Initiative
Noida, April 2024: As part of its 8th-anniversary celebrations, DLF Mall of India organized a thrilling run under the Active...


Nepal’s BLC PartnersYotta Data Services to Build Nepal’s First Supercloud Data Center
Kathmandu/Mumbai, April 28, 2024: Yotta Data Services (Yotta), India’s end-to-end Digital Transformation service provider, has announced a JV with BLC...
-
 News4 weeks ago
KW Delhi 6 Mall Onboards New Brands
-
News4 weeks ago
Commercial Realty Gets Tech Savvy: Fast Construction, Enhanced Convenience
-
News3 weeks ago
Godrej Properties Sells Rs 3k cr+ Homes of Godrej Zenith, Gurugram, within 3 days
-
News4 weeks ago
RBI’s Status Quo on Key Policy Rates to Help Maintain the Real Estate Growth Momentum, Say Industry Stalwarts
-
News2 weeks ago
Olive Announces Dhruv Kalro as Co-Founder
-
News2 weeks ago
Noida’s High-Rise Societies Face Multiple Challenges Despite Rapid Urban Growth
-
News3 weeks ago
Godrej Properties Sells 5000+ Homes of Rs 9.5 cr in Q4FY24, Bookings up 84% YoY
-
News2 weeks ago
Vestian: Domestic Investors Dominate Institutional Investments in Jan-Mar’24