News
India’s rental market continues to grow with average rents increasing 4.9% QoQ: Magicbricks

New Delhi, Aug 22, 2023 – Magicbricks, released its Rental Index for April-June 2023, observing that the rental demand across 13 major cities in India increased 18.1% QoQ , supply increased 9.6% QoQ while rents increased 4.9% YoY.
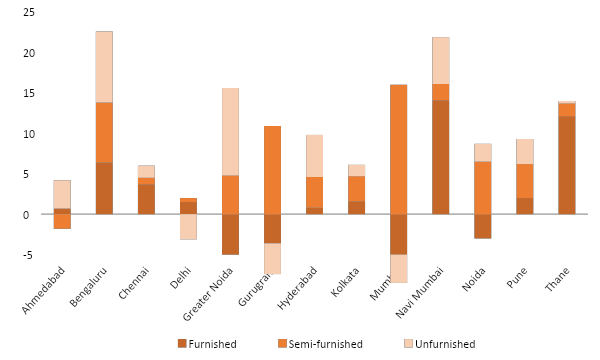
Based on the behavior and preferences of over 2 crore customers on Magicbricks platform, the report also observed that notable cities such as Bengaluru (8.1%), Navi Mumbai (7.3%), and Gurugram (5.1%) displayed the highest increment in average rents QoQ. Conversely, Delhi (- 0.9%) and Mumbai (-0.1%) witnessed marginal decline in rents QoQ.

Sudhir Pai, the CEO, Magicbricks, commented, “Over the past year, rental housing demand surged in major Indian cities, driven by returning employees and students. Return to office culture boosted the need for workplace-proximate housing while educational institutions resumed in-person activities, drawing students back to city centers. Meanwhile, as property values soared, homeowners seized opportunities for profitable property sales over rentals, reducing supply. This, coupled with high demand, notably hiked rents across prominent Indian cities.”
As per the Magicbricks Report, the popularity of 2 BHK units remains unchallenged, commanding a significant 53% share in both demand and supply, followed by 1 BHK (27%) and 3 BHK (18%). The demand for 3 BHK units declined from 36% in Q1 2023 to 18% in Q2 2023, while the demand for 1 BHK units increased from 17% in Q1 2023 to 27% in the present quarter. This shift highlights a growing inclination toward compact apartments.
The report concludes that beyond the factor of proximity to employment hubs, a significant driving force for demand this quarter is affordability. Rental accommodations with a monthly rent within INR 10,000 to 20,000 emerged as the favored choice among tenants. These preferences were predominantly observed within unit dimensions spanning from 500 to 1,000 square feet of covered area.
City Demand Supply Rent Ahmedabad 32.2% 30.1% 0.0% Bengaluru 12.8% 23.3% 8.1% Chennai 17.9% -3.0% 1.2% Delhi 18.9% 11.8% -0.9% Greater Noida 41.2% 16.1% 3.8% Gurugram 21.9% -8.9% 5.1% Hyderabad 22.0% -2.1% 4.5% Kolkata 14.8% 7.0% 2.1% Mumbai 14.9% 7.7% -0.1% Navi Mumbai 21.8% 6.2% 7.3% Noida 27.0% 3.4% 1.9% Pune 19.3% 5.3% 3.7% Thane 9.7% -2.4% 1.3%
Demand: Change in volume of rental property searches


Supply: Change in volume of active rental listings
Rent: QoQ change in the average rent of furnished, semi-furnished and unfurnished properties
The green colour indicates a positive change or growth whereas red denotes negative change or decline in trends
Source: Magicbricks Research
Source: Magicbricks Research


Ram Walase is CEO, Transindia Real Estate
Mumbai, April 29, 2024: Transindia Real Estate Ltd (formerly known as Transindia Realty & Logistics Parks Ltd), an Allcargo Group...


“Pacific Music & Masala” Fest at ‘Mall of Faridabad’, Qawalli Show by Sagar Bhatia
The Mall of Faridabad, by Pacific Group, hosted “Pacific Music & Masala” fest. Qawalli singer Sagar Bhatia performed during the...


Building a Sustainable Chennai: IGBC’s E3 Event Drives Green Building Practices
Chennai, April 27, 2024: Indian Green Building Council (IGBC) organised an event towards sustainable development in Chennai and beyond. In...


Jus’Jumpin’ Opens at Urban Square Mall
Udaipur, April 27, 2024: Urban Square Mall, Udaipur’s largest shopping and entertainment destination, announced its exciting partnership with Jus’ Jumpin’....


Delhi-NCR’s Luxury Real Estate Soars: Q1 2024 Report Unveils High-End Housing Boom
April 27, 2024: Luxury real estate sector continues to raise the bar in Q1 2024. A recent report by Cushman...


Real Estate, a Huge Employment Generator
The real estate sector in India has been a significant source of employment, with a notable increase observed in recent...
-
 News4 weeks ago
KW Delhi 6 Mall Onboards New Brands
-
News4 weeks ago
Commercial Realty Gets Tech Savvy: Fast Construction, Enhanced Convenience
-
News3 weeks ago
Godrej Properties Sells Rs 3k cr+ Homes of Godrej Zenith, Gurugram, within 3 days
-
News3 weeks ago
RBI’s Status Quo on Key Policy Rates to Help Maintain the Real Estate Growth Momentum, Say Industry Stalwarts
-
News2 weeks ago
Olive Announces Dhruv Kalro as Co-Founder
-
News1 week ago
Noida’s High-Rise Societies Face Multiple Challenges Despite Rapid Urban Growth
-
News3 weeks ago
Godrej Properties Sells 5000+ Homes of Rs 9.5 cr in Q4FY24, Bookings up 84% YoY
-
News2 weeks ago
Vestian: Domestic Investors Dominate Institutional Investments in Jan-Mar’24